
In bioreactor design and CFD simulations, it is common practice to treat cell suspensions as “water”, using a constant viscosity typically in the range of 0.9–1.1 mPa·s, and to model them as Newtonian fluids.
However, this convention can fundamentally distort calculations of shear stress and mass transfer. Studies have shown that when the fluid in the bioreactor is modeled as non-Newtonian rather than Newtonian, the calculated maximum and average shear stresses can differ by several-fold or even by an order of magnitude or more. In addition, shear-thinning behavior can suppress turbulence and increase liquid-film resistance, significantly reducing oxygen mass-transfer efficiency.
We encountered a similar issue during perfusion culture of CHO-K1 cells. On Day 9, the viable cell density reached approximately 51.7×10⁶ cells/mL. Using fresh medium under the process conditions applied at the time (550 rpm, 0.3 vvm), the measured kLa was approximately19.9 h⁻¹, theoretically sufficient to meet the oxygen demand of 108.6 × 10⁶ cells/mL, seemingly more than adequate.
However, in one validation experiment, the agitation speed was reduced to 350 rpm while aeration was maintained at 0.3 vvm. The kLa measured with fresh medium dropped to 11.3 h⁻¹, theoretically still sufficient to meet the oxygen demand of 61 × 10⁶ cells/mL, which was above the actual cell density. Dissolved oxygen should therefore have been sufficient. In practice, however, it fell below 40% saturation and could no longer be maintained.
The problem is that these kLa values were measured using fresh culture medium whose physical properties are close to those of water. The actual high-density cell suspension in the bioreactor, however, had already become a higher-viscosity, non-Newtonian fluid, with suppressed turbulence and increased liquid-film resistance. As a result, its actual mass-transfer capacity was far lower than the value measured using fresh medium.
Rheology determines whether calculated shear fields and mass-transfer coefficients are reliable. To understand why, we first need to identify the type of flow behavior exhibited by cell suspensions.
Rheology describes how materials flow and deform under applied forces, while viscosity is a key parameter characterizing a fluid's resistance to flow.
For Newtonian fluids such as water, viscosity remains constant regardless of shear rate, and shear stress is proportional to shear rate. These are known as Newtonian fluids.
By contrast, materials such as ketchup and yogurt are thick at rest but become less viscous when stirred. Their viscosity varies with shear rate, and they are collectively known as non-Newtonian fluids. The phenomenon in which viscosity decreases as shear rate increases is known as shear thinning.
On a rheometer, a plot of viscosity against shear rate appears as a horizontal line for a Newtonian fluid, whereas a shear-thinning fluid produces a downward-sloping curve.
Let us first consider an hUC-MSC (human umbilical cord-derived mesenchymal stem cell) microcarrier culture system, in which the culture medium is typically supplemented with 10% serum.
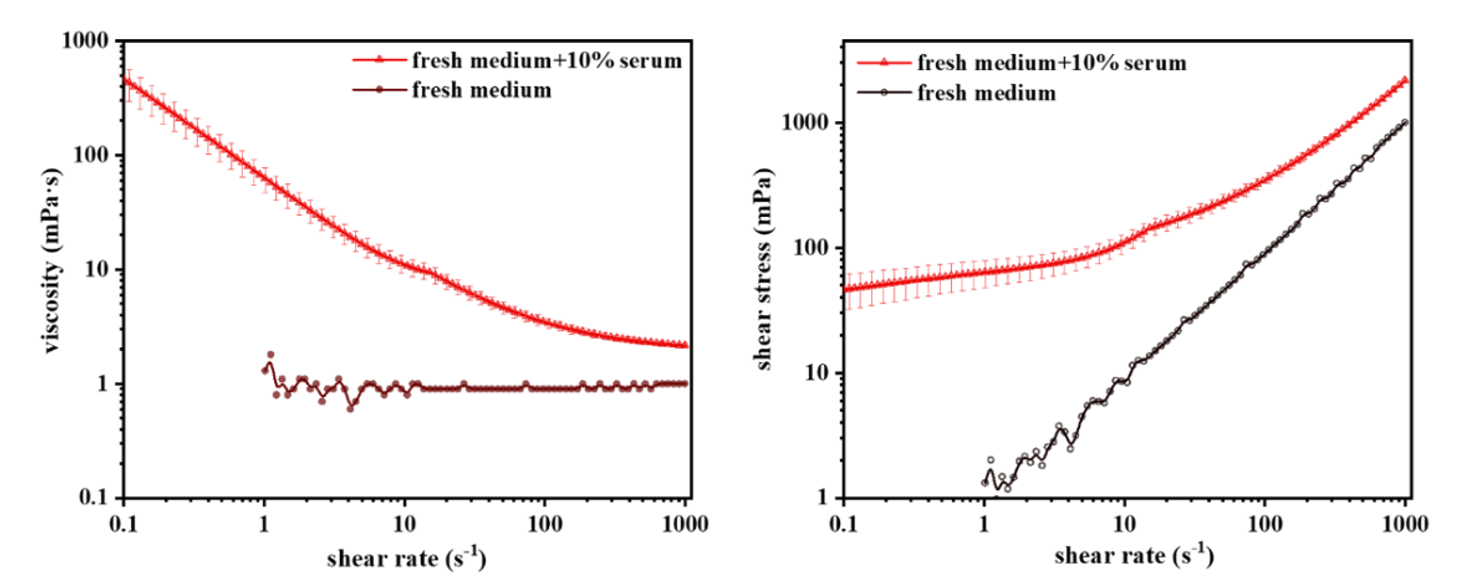
Effect of Serum Addition on Medium Rheology: Changes in Viscosity and Shear Stress with Shear Rate
The black curve in the figure represents DMEM without serum supplementation. Its viscosity remains constant at approximately 0.9 mPa·s, producing the horizontal line characteristic of a Newtonian fluid.
The red curve represents medium supplemented with 10% serum. At low shear rates, its viscosity reaches several hundred mPa·s, hundreds of times that of water. As the shear rate increases, the viscosity drops sharply before eventually leveling off. The addition of just 10% serum is therefore sufficient to transform the medium from Newtonian to non-Newtonian behavior.
The key lies in serum proteins. Serum contains approximately 40–80 mg/mL protein, corresponding to about 4–8 mg/mL when added at 10%, with bovine serum albumin (BSA) being the most abundant component.
At low shear rates, close to the resting state, BSA molecules can self-assemble into a colloidal network with a body-centered cubic crystal structure. The fluid must first overcome this network before it can flow, resulting in high viscosity. Once agitation begins, the structure is disrupted by the applied forces and the viscosity drops sharply.
This reveals one molecular basis of shear thinning: the reversible “assembly–breakdown” of microscopic structures.
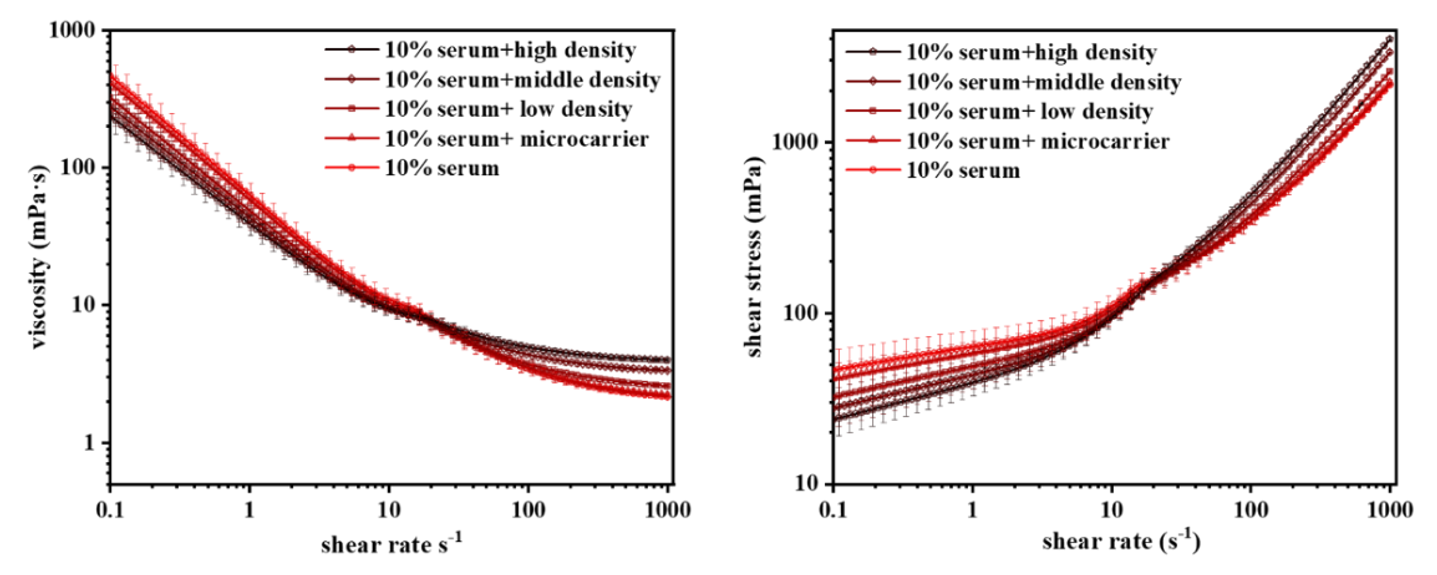
Comparison of the Rheological Behavior of Cell Suspensions at Different Cell Densities
The curves in the figure represent suspensions with different cell densities, ranging from low to high, together with serum-containing medium alone.
The curves intersect at a shear rate of approximately 20 s⁻¹: in the low-shear region (<20 s⁻¹), viscosity decreases as cell density increases, whereas in the high-shear region (>20 s⁻¹), viscosity increases with cell density. This reversal is key to understanding the interaction between cells and serum proteins.
This behavior can be attributed to the hydrophobic core and hydrophilic outer-layer structure of BSA, which enables BSA to readily adsorb onto the hydrophilic cell surface and glycocalyx, forming a protective coating. This is one of the mechanisms by which serum can help protect cells against shear stress.
As the number of cells increases, more free BSA is adsorbed onto cell surfaces, leaving fewer protein molecules in solution to form the colloidal “scaffold.” Consequently, the high viscosity observed at low shear rates is reduced.
In the high-shear region, however, the protein network has already been disrupted, and viscosity is instead dominated by the physical obstruction to flow caused by cell-microcarrier aggregates. The higher the cell density and the larger the aggregates, the greater the obstruction and, consequently, the higher the viscosity.
Therefore, proteins dominate at low shear, while cells dominate at high shear.
High-density CHO cell culture generally uses serum-free media, meaning that no BSA-based network is present. Yet these suspensions still exhibit pronounced shear-thinning behavior. In this case, the cells themselves play the dominant role.
We systematically ruled out potential factors to identify the key determinant. Cells from the same CHO batch were resuspended separately in fresh medium and culture supernatant containing antibodies, lactate, cell debris, and other components. At the same volume fraction, their rheological curves nearly overlapped.
Although the supernatant had a slightly higher viscosity than the fresh medium (1.1 vs. 0.9 mPa·s), both behaved as Newtonian fluids. This indicates that medium composition does not determine the shear-thinning behavior of high-density cell suspensions. Monoclonal antibody solutions do not exhibit appreciable shear-thinning behavior until the antibody concentration exceeds 52.7 g/L, far above typical concentrations encountered during cell culture.
We then compared CHO-DG44 cells with diameters of 13–16 μm and CHO-GS/K1 cells with diameters of 16–22 μm. At the same volume fraction, their rheological curves again nearly overlapped. Within the approximate range of 15–20 μm, cell size therefore does not appear to be the determining factor.
After ruling out medium composition and cell size, cell volume fraction (Φ), defined as the fraction of the suspension volume occupied by cells, emerged as the key determinant.
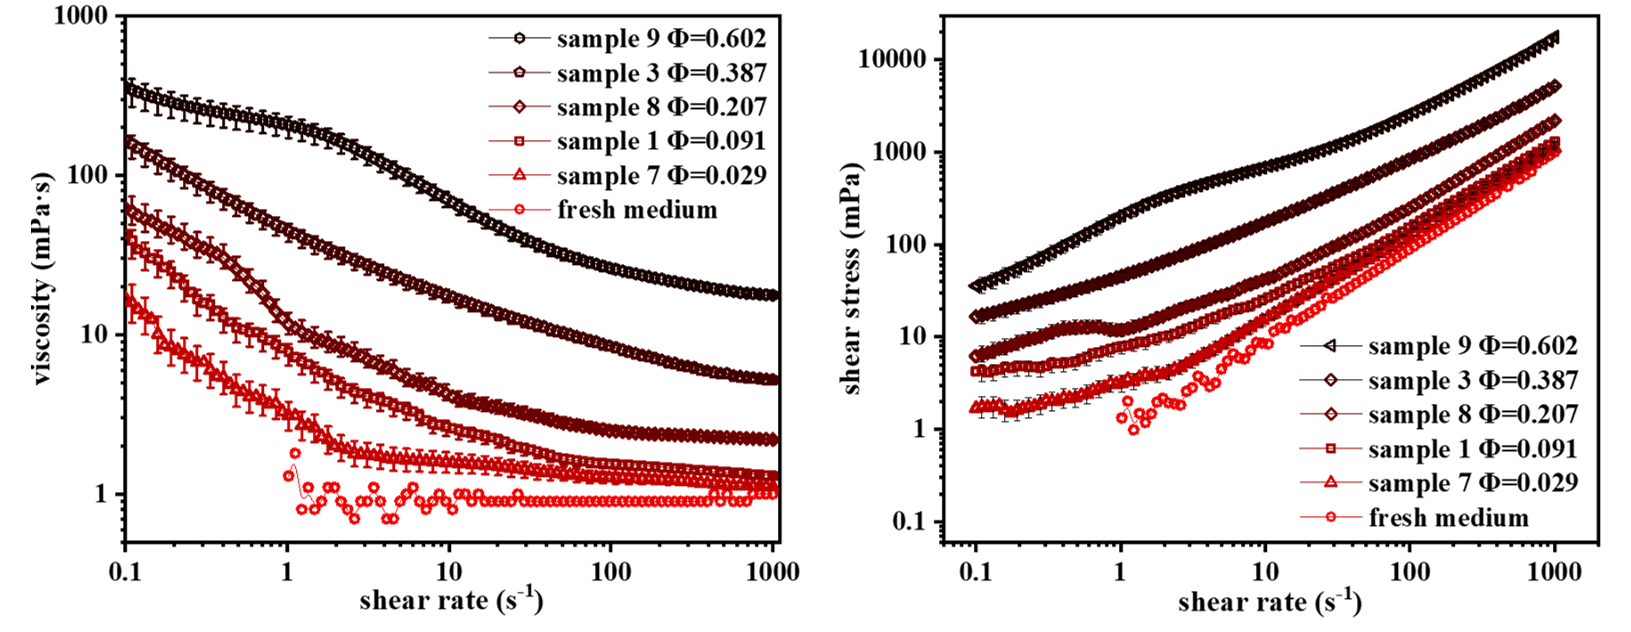
Comparison of the Rheological Properties of Cell Suspensions at Different Volume Fractions
In the figure, Φ increases from 0.029 to 0.602, meaning that the volume occupied by cells increases from 2.9% to 60.2%.
Two trends can be observed. First, at a given shear rate, viscosity increases with Φ. At low shear rates, the viscosity of the highest-density sample exceeds 300 mPa·s, several hundred times that of the culture medium.
Second, the curves become steeper at lower Φ values, indicating a greater decrease in viscosity from low to high shear rates and therefore more pronounced shear-thinning behavior. As Φ increases, the curves become flatter. In other words, as the cells become more crowded, the extent of shear thinning becomes less pronounced.
This is the opposite of the behavior observed with inert glass beads, for which increasing crowding results in stronger shear thinning.
Why do cells behave differently?
Shear thinning in particle suspensions fundamentally arises from two microscopic mechanisms:
Adhesive Aggregation
Particles adhere to one another and form aggregates that obstruct flow. At low shear rates, these aggregates remain intact, whereas at high shear rates, they are disrupted.
Closely packed particles impede one another. At low Φ, particles are relatively far apart and frictional interactions are weak, so adhesive aggregation dominates. At high Φ, particles become crowded and frictional interactions become dominant.
Two fundamental differences between cells and glass beads explain the reversal in behavior.
Glass beads aggregate primarily through weak van der Waals forces, producing small and fragile clusters. Cell membranes, by contrast, contain abundant adhesion molecules that mediate specific cell-cell attraction and adhesion, resulting in larger and more robust aggregates. Consequently, at low Φ, shear thinning is much more pronounced in cell suspensions than in glass-bead suspensions.
In addition, hydrophilic groups on the cell membrane interact with water molecules to form a bound-water layer at the cell surface, which promotes interfacial slip. Under high-shear conditions, this layer reduces direct fluid-cell surface friction, thereby decreasing the resistance to flow caused by the cells.
As Φ increases and the total cell surface area grows, this slip effect becomes more pronounced. Together, these mechanisms give rise to the distinctive trend in which shear-thinning behavior becomes weaker as Φ increases.
Finally, we quantified these relationships. The rheological curves can be accurately fitted using the Sisko model (R² > 0.99). Compared with the power-law and Herschel-Bulkley models, the Sisko model captures the full transition from a steep decrease in viscosity at low shear rates to a plateau at high shear rates, whereas the other two models show clear deviations in the high-shear region.
All samples were fitted using the Sisko model (R² ≈ 0.99), after which the model parameters were correlated with Φ.
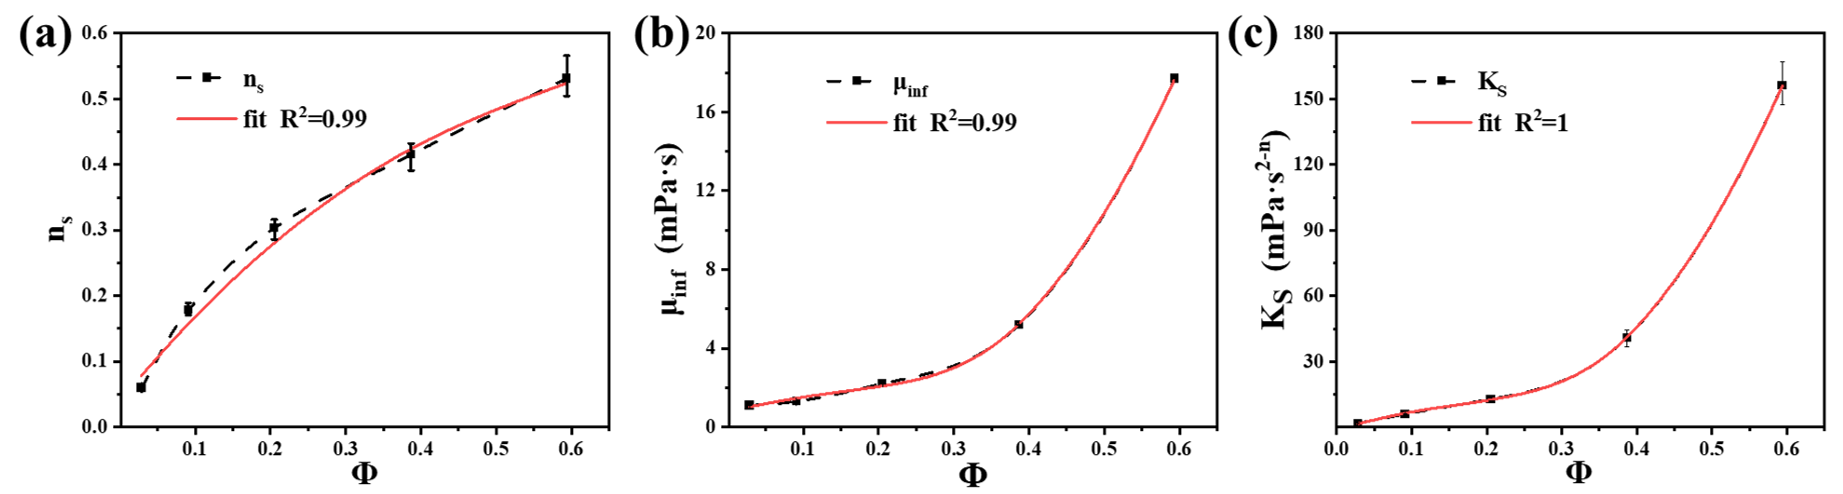
Relationship Between Sisko Model Parameters and Cell Volume Fraction; Red Curves Represent Model Fits for Each Parameter
In Figure (a), the flow behavior index n_s increases with Φ. Because a lower ns indicates stronger shear thinning, this quantitatively confirms the trend that shear thinning weakens as Φ increases. The relationship can be described by the quadratic equation: ns = −1.0204Φ² + 1.4231Φ + 0.0388
In Figures (b) and (c), the infinite-shear-rate viscosity μinf and consistency index Ks increase gradually when Φ is below 0.3, but rise exponentially once Φ exceeds 0.3. This indicates that viscosity increases sharply once cell density reaches a certain level.
With these correlations, future bioreactor design and CFD simulations for high-density CHO culture can estimate the actual viscosity at any shear rate simply by calculating Φ from cell density and cell diameter.
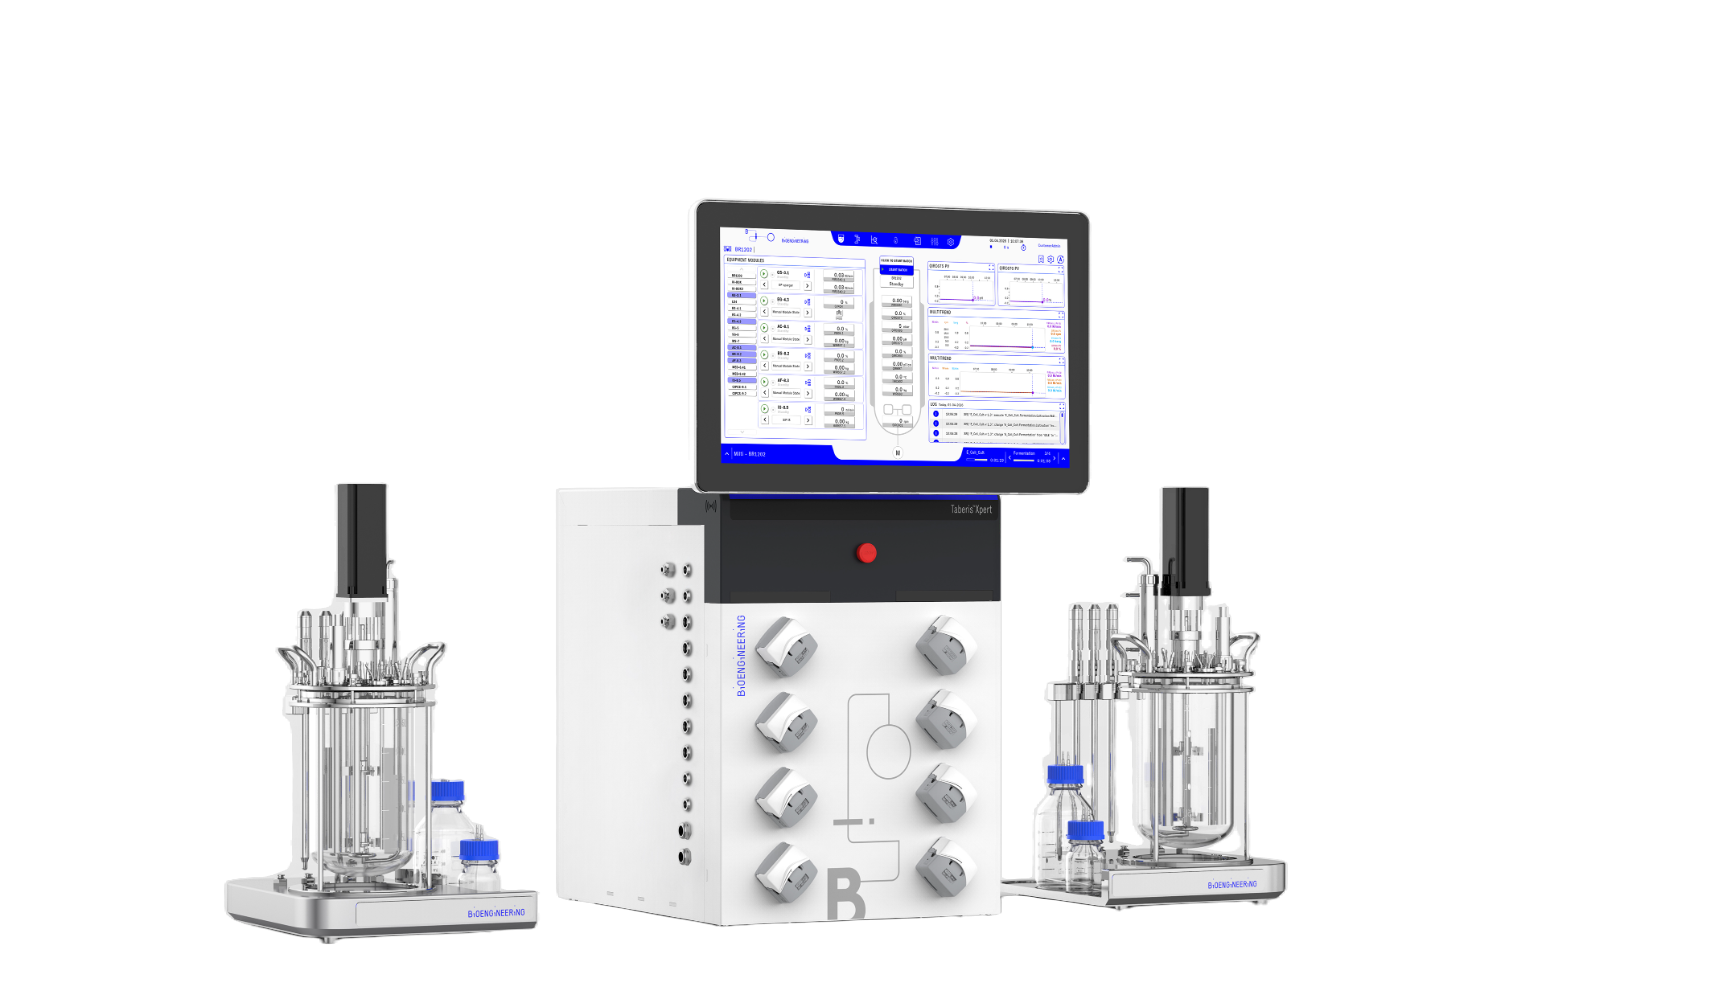
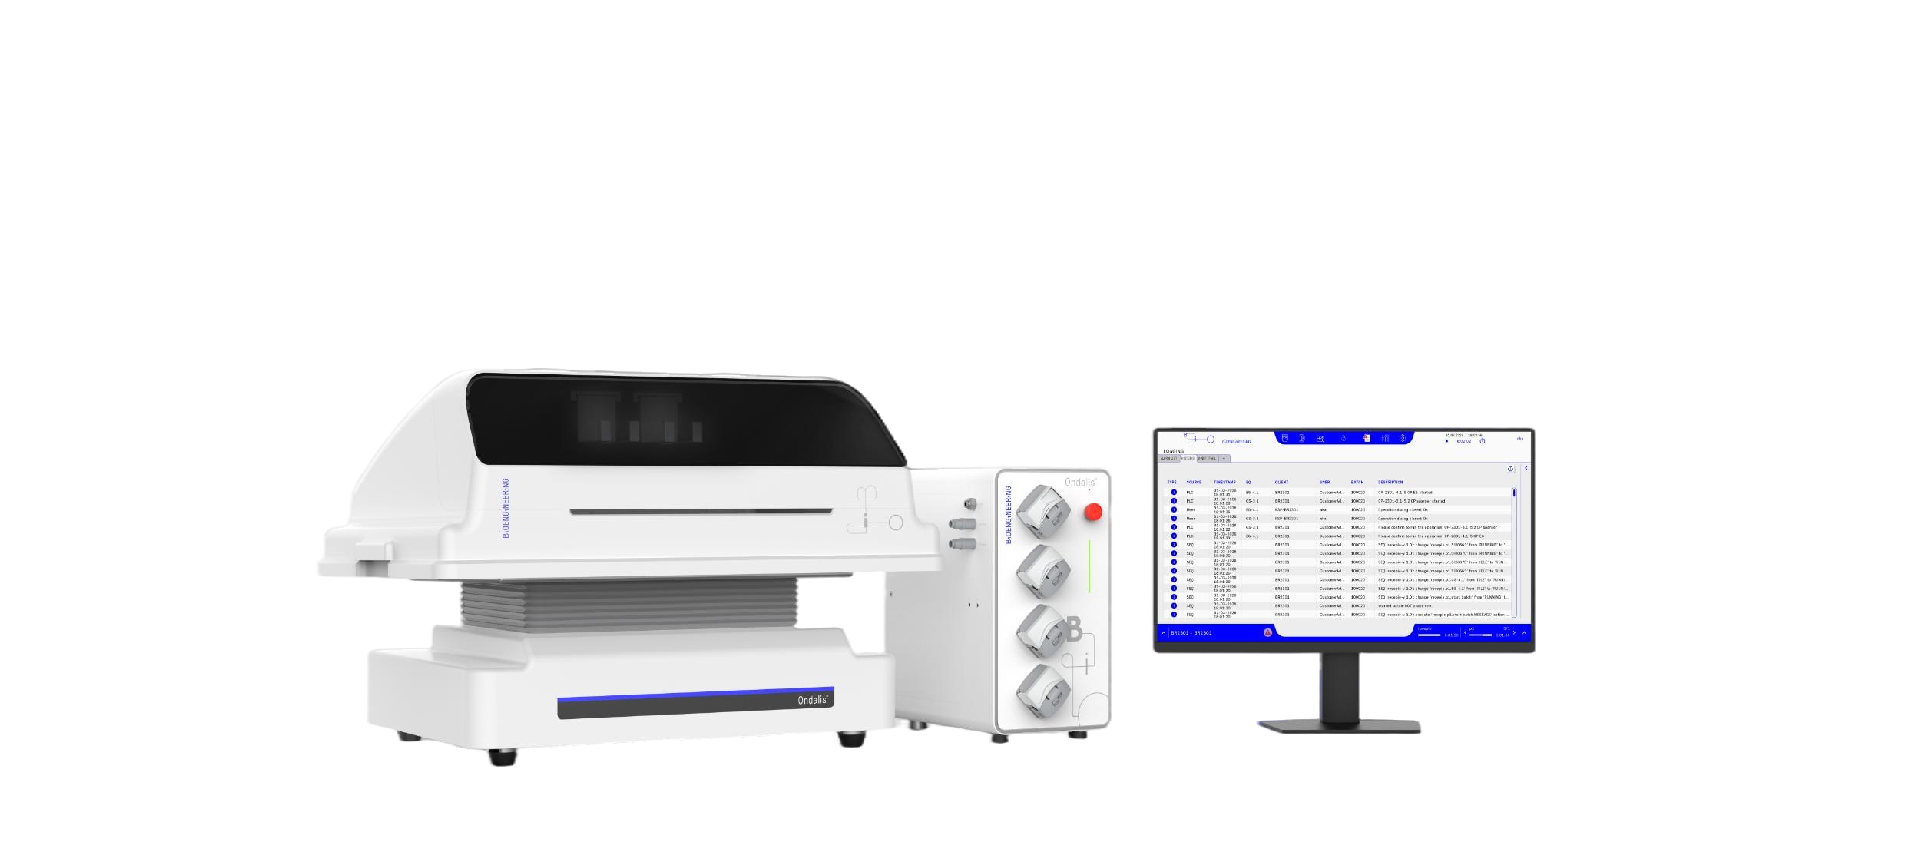
Bioengineering Taberis Xpert Bioreactor Bioengineering Taberis Prime Bioreactor
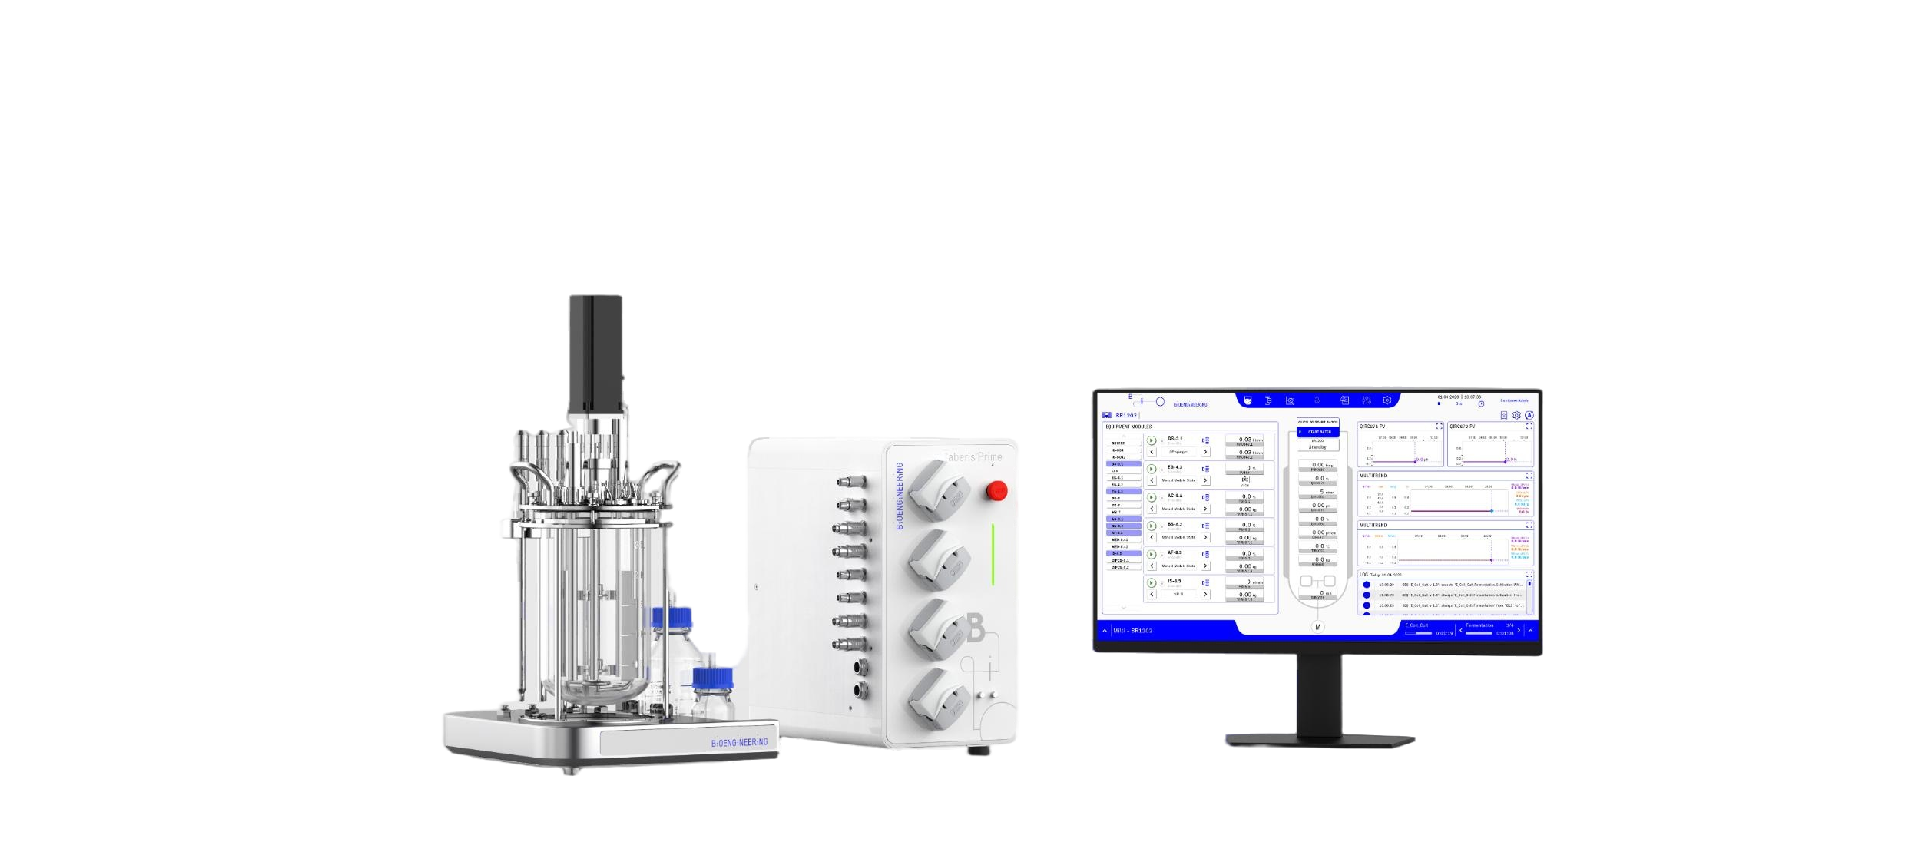
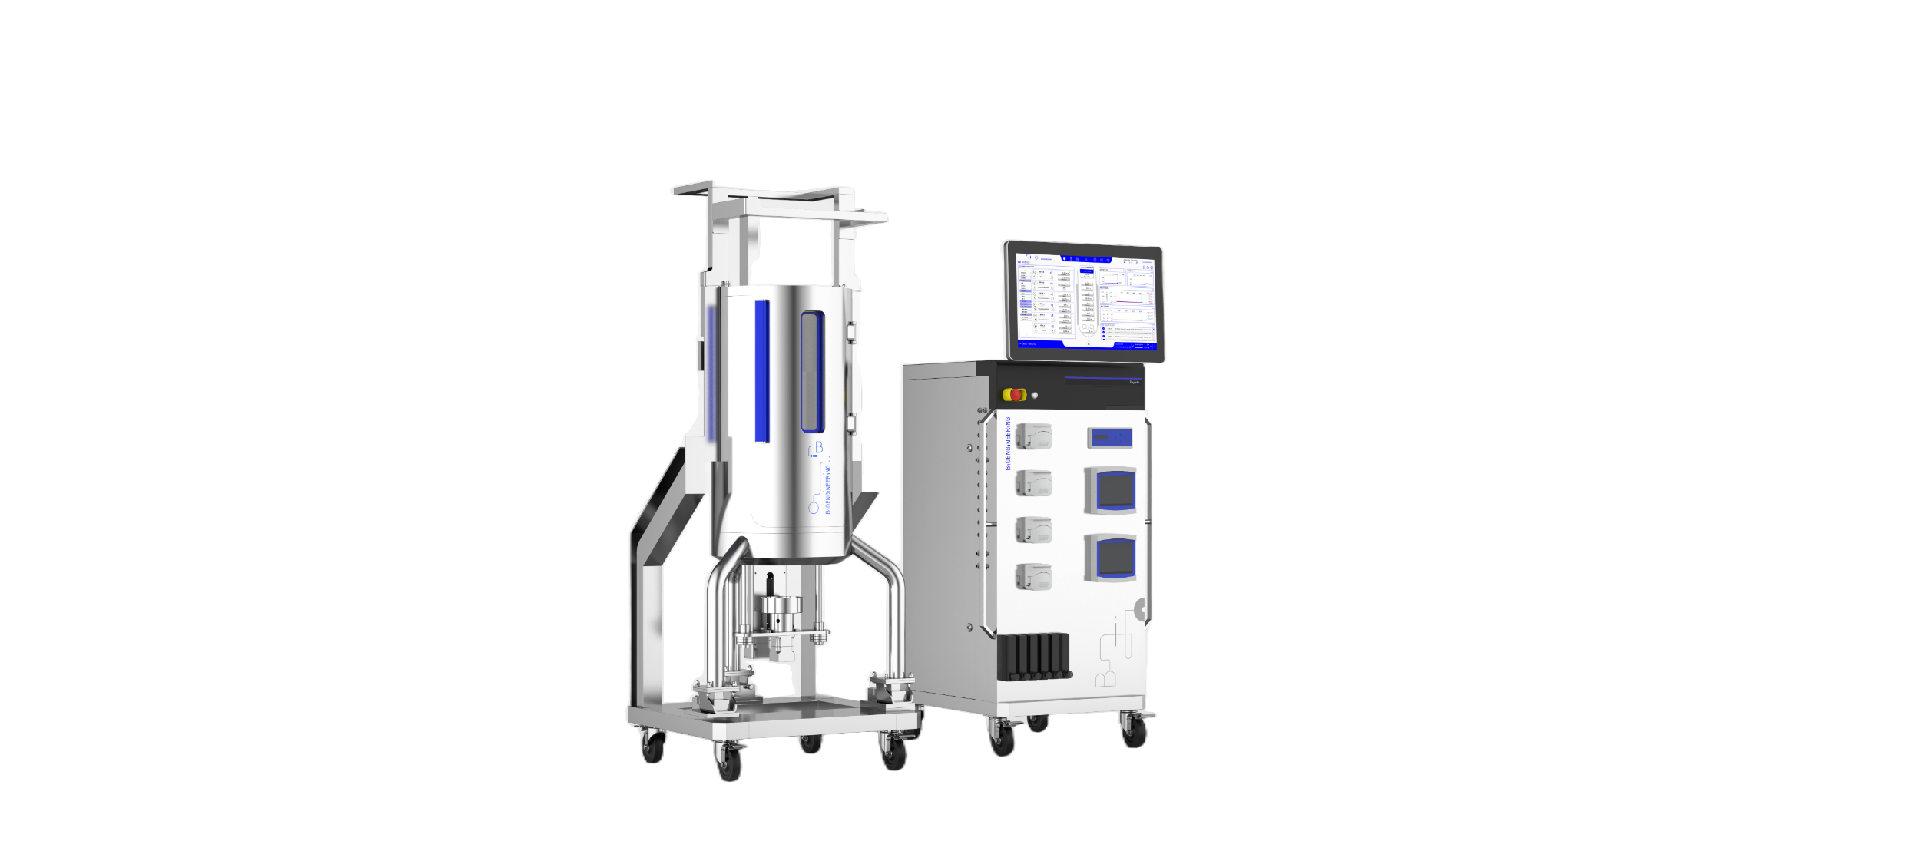
Bioengineering Bagento Single-Use Bioreactor Bioengineering Ondalis Wave Single-Use Bioreactor
Cell suspensions are not water. In an hUC-MSC system, the suspension is a dynamic fluid shaped by the reversible “assembly–breakdown” of a serum-protein colloidal network. In a CHO system, it is a complex fluid governed jointly by cell aggregation mediated by adhesion molecules and interfacial slip associated with the hydrophilic cell surface. These microscopic characteristics directly affect the reliability of shear and mass-transfer calculations in a bioreactor. If a high-density cell culture system is modeled under a Newtonian-fluid assumption, the resulting representation of the cellular microenvironment may be fundamentally distorted.
How exactly does rheology affect the shear field and mass transfer, and how can these effects be accurately incorporated into CFD models? We will explore these questions in the next article.
About Morimatsu LifeSciences
Morimatsu LifeSciences is a key business segment of Morimatsu International Holdings Limited (Stock Code: 2155.HK). It comprises Shanghai Morimatsu Pharmaceutical Equipment Engineering Co., Ltd., Morimatsu (Suzhou) LifeSciences Co., Ltd., Shanghai Morimatsu Biotechnology Co., Ltd., Shanghai Mori-Biounion Technology Co., Ltd., Shanghai Morisora Technology Co., Ltd., Bioengineering AG, Pharmadule Morimatsu AB, and its affiliated companies.
Morimatsu LifeSciences is dedicated in providing core equipment, process systems, and smart modular facility solutions, and services for the pharmaceutical, biopharmaceutical, medical aesthetics, and fast-moving consumer goods (FMCG) sectors including (cosmetics, food, and health supplements), as well as data centers.
Our team comprises highly experienced professionals with deep expertise in process R&D, engineering design, advanced manufacturing, compliance and validation consulting, production execution, and intelligent operations. With broad experience across diverse industries, we fully understand the unique characteristics and process requirements of various products. This enables us to deliver tailored, end-to-end process solutions from the conceptual design stage, precisely aligned with client’s specific needs.
Morimatsu LifeSciences has established a strong global presence, supported by advanced R&D centers, design hubs, and state-of-the-art manufacturing facilities worldwide. Our well-established service network spans Europe,USA,Asia-Pacific, and emerging markets. We have successfully delivered outstanding, customized solutions to clients in over 40 countries and regions, gaining extensive experience in international project execution.
As a multinational enterprise with core strengths in process technology, modular facility construction, and intelligent manufacturing, Morimatsu LifeSciences is dedicated to meeting the evolving equipment and system needs of our key industries. Through continuous innovation and technological advancement, we are steadily expanding our global footprint, driving our international strategy forward, and delivering Morimatsu’s expertise, reliability, and innovation to the global life sciences and related sectors.